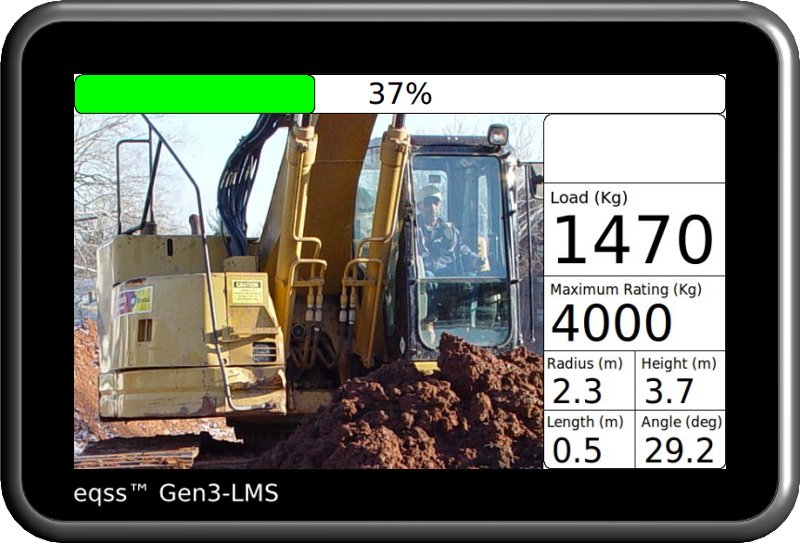
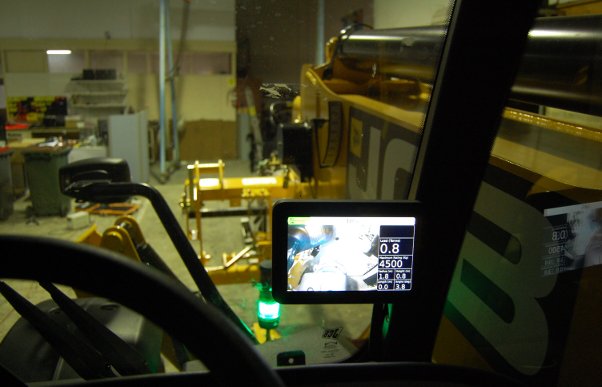
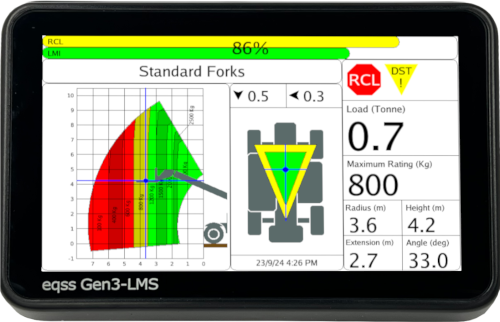
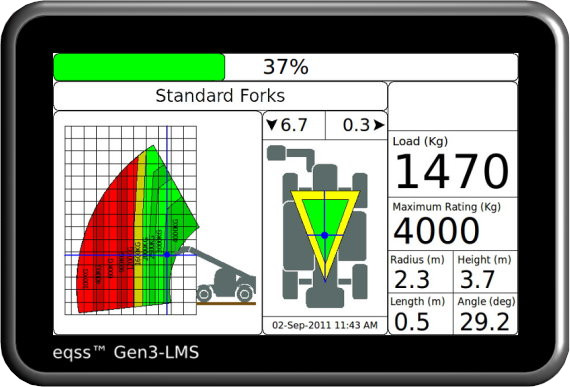
The load percentage display shows the current load as a percentage of the maximum load according to the rating chart for the current boom position. It displays both a percentage bar and the value.
The percentage bar is colour coded depending on the percentage.
The bar is green when the capacity is between 0 – 79 percent
The bar is yellow when the capacity is between 80 – 99 percent
The bar is red when the capacity is greater than 100 percent
The Gen3-LMS can be integrated with the machine’s existing Load Moment Indicator (LMI) or the LMI percentage can be calculated from the current load. When displaying LMI the load percentage changes to two bars. The RCL percentage is displayed on the top bar with the LMI percentage displayed on the lower bar. The percentage value displays the highest of the two values.
This displays the description of the currently selected attachment to allow the operator to clearly see which attachment configuration the Gen3-LMS is using.
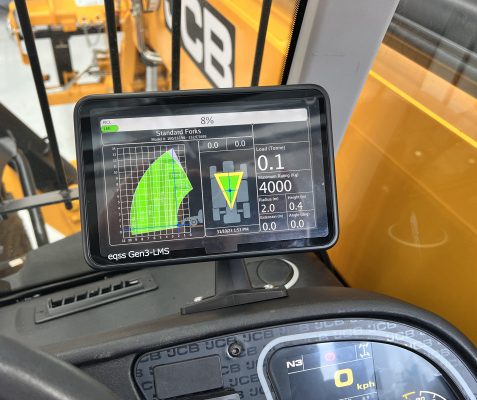
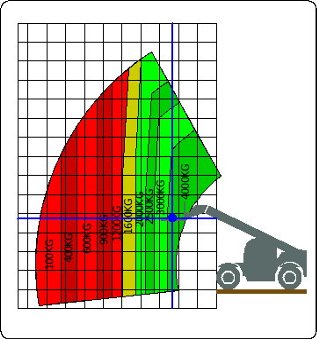 The Gen3-LMS displays a fully dynamic rating chart for the selected attachment. With the telehandler overlay it allows the operator to quickly determine at a glance the current location within the boom’s range of movement and how much further the boom can be extended with the current load. The rating chart also incorporates a zoom feature which allows the operator to zoom into the rating chart for further detail.
The load segments on the rating chart are colour coded to match the current load. If the segment is green and the boom is moved inside the segment the rated capacity percentage would be between 0% – 79%. If the segment is yellow the capacity would be between 80% – 99% in that region and if red the capacity would be 100%+ in that region. This allows the operator to lift the load and determine the boom range before the lift is performed.
The rating chart also has an image of the telehandler showing the current boom location within the chart. The telehander image also changes the attachment to match the currently selected attachment. When both stabiliser are lowered the telehandler image is updated with stabilisers shown front of the tyre.
The current position within the chart is shown via crosshairs. With the chart grid in 1 metre increments the operator can determine the distance the load can be safely moved.
For more detail the operator can zoom into the chart. This will zoom into the current load centre location in the chart, as the boom approaches the edge of the chart the window will slide along to keep the load centre in view.
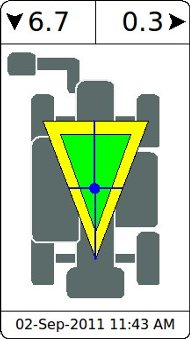
The stability triangle shows the current centre of mass of the telehandler taking into account the lifted load and the carrier angle. The centre of mass location is indicated by the crosshair. The centre of mass is overlay over the stability triangle, which is drawn between the front tyres and the centre of the rear axle. If the centre of mass moves outside of the triangle there is a danger of tipping the telehandler. When both stabilisers are lowered the stability triangle is redrawn between the stabilisers and rear axle.
The longitudinal carrier stability angle is shown in the top left corner of the stability window. The lateral carrier stability angle is shown in the top right corner of the stability window. Arrows are shown beside the each carrier angles to indicates the direction of the carrier tilt.
When a stabiliser is lowered the telehandler image is updated to show the new stabilser down state. When both stabilisers are lowered the stability triangle is enlarged and redrawn between the stabilisers and rear axle. If one of the stabilisers is not down and pressurised the stability triangle remains between the front tyres and rear axle.
 The status window shows all the numerical values related to the load and the boom location.
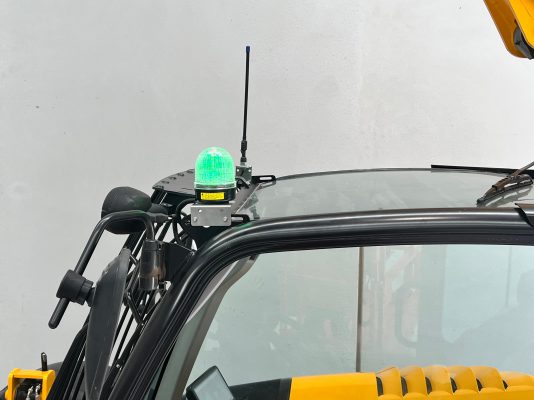
The top of the status window is the status icon area, when any events that the operator needs to be aware of such as an overload the cutout icon will be shown in the icon area.
Below the status icons is the current load and the maximum capacity as defined by the rating chart, both are displayed in large easily readable text.
At the bottom of the status window are the boom position values; radius, height, boom length and boom angle.


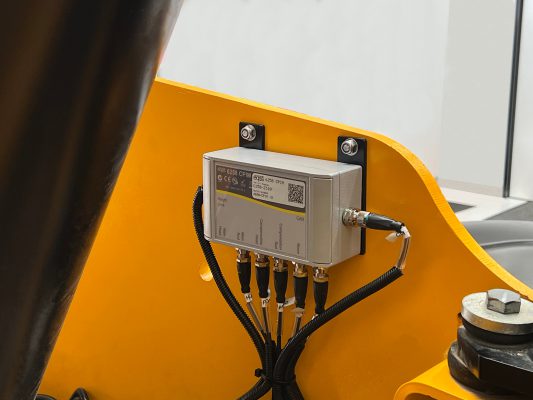


 The Gen3-LMS displays a fully dynamic rating chart for the selected attachment. With the telehandler overlay it allows the operator to quickly determine at a glance the current location within the boom’s range of movement and how much further the boom can be extended with the current load. The rating chart also incorporates a zoom feature which allows the operator to zoom into the rating chart for further detail.
 The status window shows all the numerical values related to the load and the boom location.